Wednesday, 12 December 2012

Lab 5: Audio Signal Processing

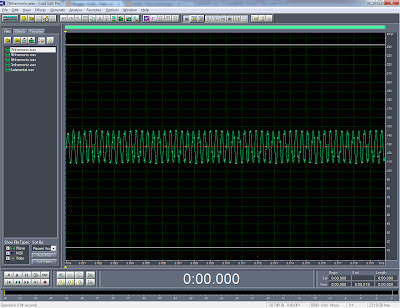
The purpose of this lab was to download a sound, entitled "speechtone.wav" and edit it to improve the sound. On first listen, there was a high pitched sound interfering with the clip and the speech was very muffled and incoherent. In cool edit pro, the speech appeared like this in its original state:


I was then left with the following wave, which by this point had made the speech far more coherent but the high pitch sound still remained. The improvement in the sound was achieved by applying various notch filters at 440Hz and 2dB.


I then continued to add notch filters as before but supplemented this by adding a hiss reduction, as well as lower tones and upper tones. There was a massive drone at the start of the sound and at the end, so I decided to significantly reduce the amplitude of both of these parts, by three decibels at a time, until they were drowned out sufficiently. The wave now appeared like this:


The next part of the lab was to make the speaker in the sound appear to be angry. I aimed to do this by making the beginning of each sentence louder, boosting the amplitude by 6 decibels. I also added a 6 decibel boost to last section of speech so the sound seemed to maintain being angry. I increased the angry tone, making it appear as if the speaker had raised their voice by also adding in an amplitude feature named fade in, and gave it a 10 decibel setting.


The next part of the lab was to make it sound like the sound had taken place in a church. I did this by adding a "reverb" delay effect and choosing the "large empty hall" option. As the name suggests, it gives the effect of being in an empty hall, which a church can often sound like. The speech sounds more bellowing and as if it may produce an echo. 


Finally, I had to incorporate a bell sound into the file. I downloaded a wav file from the internet which was a repeated church bell. I opened this file up in Cool Edit Pro and then selected "Copy" and "Mix Paste". After I performed this action the bells continued long after the speech, so I decided to cut that bit out, so the file wasn't too prolongued. The bells being added in not only gave the sound the desired effect, but also helped filter out the slight remaining high pitched sound. The final shot looked like this:


Thursday, 6 December 2012

Lab 7: Video Processing

The first step of the lab was to download video files, which would be used in the lab. The purpose of this lab is to show our understanding of how to edit video files. The particulars of the task is to make a video which is exactly one minute long, adding appropriate background music and aiming to incorporate themes of drama and cuteness.

Having analysed all of the videos which were suitable to edit, I carefully considered how I could make the video appear "cute" and "dramatic". All of the footage was about ducks and swans and by reputation swans are more aggressive so I decided to create the drama by trying to replicate a game of "hide and seek" with the swan coming to find the ducks. 

The video had to be exactly a minute long and consist of footage from at least three of the files we had to download. The first of the three was a clip of various ducks scurrying away from swans across a pond. I managed to supplement this by the second one being a clip of a solitary swan looking around, as if to suggest it was looking to find where the ducks may be hiding. I moved from this with my final clip which showed a duck swimming into a bushed area in the water, creating the effect that if he was in this area he would be invisible to the onlooking swan.

Finally, I added music to make the video more complete. I choose piano music which had a frequency which created a dramatic effect, but a light hearted vibe to it to maintain the cuteness  requested.

Another thing I considered throughout the lab was to make sure that when I was changing to a scene from a different video, the transition appeared as natural as possible and gave the user the impression that the footage was all from the one video.

The video can be viewed at the below link on YouTube:

http://www.youtube.com/watch?v=LseWTfAahXQ

Tuesday, 4 December 2012

Lecture 7: Looking at Light, Part Two

Light:


Light is a form of energy detected by a light, which depending on certain factors can appear in the form of a wave or a stream of particles. As we have learned previously, sound needs a medium to travel through, but this is not the case with light, it can travel from the sun through space to reach earth.

Having previously covered longitudinal and transverse waves regarding sound, light falls into the second category, where the waves resemble a ripple in water. The vibrations occur at right angles to the direction of movement from the source which created the wave. Waves of light form what is referred to as a radio wave and when the eye recognises this wave it takes the part of the radio receiver. Light which is visible to humans tend to occur between 400 THz to 750 THz (Terahertz are Hertz multiplied by 10 to the power of 12). The range of frequencies appear in a vast range of colours, typically low frequencies appear red and high frequencies appear violet with various other stages in between. The colour white appears as a mixture of many different colours.

Velocity of Light


In a vacuum, light has a constant speed of 300,000 kilometres per second, with it being slighty less and air and down to approximately 200,000 in glass. The halt in speed in glass means it is useful for lenses. Light travels about a million times faster in air than speed does.

To travel a 6m length, you can measure the time taken by the following formula.

Time taken = Wavelength/Velocity

= 6 / (300000000)
= 20 ns

The frequency of a light wave is the number of complete cycles per second, which is independent from the medium it is travelling through. The formula for working out Velocity is to multiply the frequency by the wavelength. It is the same formula discussed at length in lecture one.

A 500 THz lightwave has a wavelength in air.

Wavelength = Velocity (300 x10 to the power of 6) / Frequency (500 x10 to the power of 12)

= 600 mm

The below chart shows the frequencies at which colours are prevalent, so we can assume this wave will be orange. It would still appear the same if the medium to change from air to glass, as  like previously mentioned, the frequency is independent to the medium.


White light, originating from the sun, it's a combination of all of the colours in the visible spectrum. Some colours have more presence than others and this varies greatly from source to source. 


The above diagram shows a Visible Light Spectrum, showing which kind of waves have which levels of frequency from the low frequency radios and microwaves, moving towards the higher frequency X-rays and gamma rays. Below is another diagram which gives an indication on frequency for each independent colour on the spectrum. The variation in colours of visible light have different frequencies.


The majority of light sources don't radiate single colour light, often referred to as monochromatic. However, a rare source for this is the yellow street light (sodium), giving off the effect of total colour-blindness, aided by the incorporation of shades of grey.

The brightness of light is measured by units called candela and human. These are more prevalently used by scientists rather than photographers, who use light exposure meters measured against a scientific standard. Object brightness is an extremely biased quality and is very much dependent on reflectance, colour and surroundings as well as the possible different state of the onlooking eye.

Environmental Effects On Light:

Both the atmosphere and surrounding objects affect light ways by the following means:


  1. Transmission
  2. Reflection
  3. Absorption
  4. Scattering
  5. Refraction
A large fraction of the incident light is transmitted by transparent or translucent objects. For example, the reflection of the surface surroundings are what is revealed in glass, were there none it would be invisible. Reflecting glass on to an object can make the shape appear differently. 

Light intensity varies:

The intensity of light received from a source varies inversely as the square of the distance R from the source as 1/R squared. This means that a light reflected from an object will have one twenty-fifth of the intensity at a distance of five metres from observation, than it would from one metre.

Editing the colours and the contrast of an image can affect the perception of distance. For example as the amount of blue in an image is increased and the amount of contrast is decreased, an image will appear further and further away.

On the occurrence of energy travelling between mediums, typically some is passed while some is reflected. Reflections from a flat boundary appear like a mirror, but reflections from a curved surface tends to be focused to a point, line or area.

Specular reflection normally takes a mirror like form, whereas diffuse light occurs as a result of light scattering in various directions, adjacent objects typically colour each other through their reflective light, despite occasionally casting shadows on each other. An example of diffuse light would be the sun giving a piece of clothing a brighter illusion.

It is often asked why the sky is blue, when the air around us appears to have no visibility. Various factors in the air - molecules, vapour and dust particles - scatter sunlight throughout the air and short wavelength light is far more common than long wavelength light and as previously described, blue light occurs at short wavelengths, with long wavelength light going more towards red light. The sky appears more red upon the sun setter as the dust and vapour are travelling a longer path, through denser air, which compromises much of the blue colour, which appears to be scattered away. As a result of this, it becomes evident how a user can simulate a sunset effect on an image, as the image will be comprised of blue, green and red colours, it makes sense to increase the red at the expense of the other two, which will be further aided by being reduced, to reach the desired effect.

Refraction is when light gets bent being passed between mediums and occurs due to the fact that the speed of light varies in different material. When light takes an angled approach at hitting a boundary, it must decrease or increase in speed before it passes through and reaches the new material.


Monday, 3 December 2012

Lecture 4: Speech

Human Speech:


A learned communication system. Consists of three major components- voice, articulation and language skills.  Voice (also known as phonation) is the sound resulting from the movement of air through the vibration of the vocal cords of the voice box (larynx). The vocal chords consist of an elastic tissue, used for connections, which is covered by folds of mucous membrane. Vibration can occur by air passing in or out the lungs, it is possibly apt to liken it to the reed of a harmonica in this respect. The pitch that the vibrations take place add can be modified by muscles that see the vocal cords shortened and tightened for high pitched tones and loose and longer for low frequency tones. Approximately, the frequency range of speech is 80 Hz to 8 KHz, meaning the highest pitch of high quality speech is one hundred times higher than the lowest pitch.

There is a difference between speech and singing. A properly trained singer can produce a wider range of sounds than are produced in normal speech. They also aim to control their breath and have more regulated tension in their vocal chords. Yodelling for example is something that wouldn't be achievable by singing as it constantly alternates between high and low registers.

Articulation is when the larynx modifies air flow and the production of phonemes (basic speech sounds) is complete, the phonemes are then combined to form words of a language. The movement of tongue, lips, lower jaw and soft palate articule speech, interrupting and shaping the voiced and unvoiced airflow. There are approximately 40 phonemes for the English language which are classified in four categories - vowels, nasals, plosives and fricatives. This is specific to the English language, it may vary for others.

Phoneme Types:

Vowels: Generated from oscillatory excitation of the vocal track. In this process, the articulators remain static and the sound radiates from the mouth. Vowels are acoustically served by the first three of four vocal tract harmonic resonances, of which the correct terminology for is formants.

Nasals: When sound is radiated from the nasal cavity due to the raising of the tongue and the lowering of the velum (soft palate), nasals are generated:

Plosives: Produced by the sudden burst of pressure, resulting from the front of the vocal tract being shut by the tongue or the lips.

Frictatives: Similar to plosives, but these are formed by the partial restriction of the vocal tract rather than the full closure of it.

Time Domain Features:

Speech showcases bursts of localised and differentiated activity and by rule is never stationary.  Despite there being no gaps between words in speech, there can still be silence periods between them, the word speech itself containing two. This can sometimes aid the diagnosis of noise characteristics. Amplitude can very in speech, this can be referred to as a modulation process. Speech modulation tends to range between 0.25 Hz to 25 Hz, with the standard peak being between 3-6 Hz.

Voice Production Summary:

Lungs take the role of air reservoir and bellows, which act to force air between the vocal cords of the larynx. Unvoiced sounds form when the cords are relaxed and fail to vibrate, this can be simplified as a silence.

A Model of Voice Production:

This is often known as signal generation and can be used to create synthetic speech. Learned patterns in the brain interact with the nervous system, who in turn interact with local musculature,  which generates signals using the vocal chords, power supply using the lungs and resonators and articulators to process the signals.

Assumptions of Linear Predictive Coding

The vocal tract's characteristic mean that shape can not be changed at a particularly quick rate, current sound can often be found to be derived from the sound produced shortly before, approximately 25 ms. This means over this short period of time, new speech can be predicted to an extent, meaning the possibility of a recursive digital filter, measured in Hertz. 

Coding advantages are that as well as generating synthetic speech, the LPC approach has a coding advantage as the parameters to specify content in a speech frame is significantly less than the number of samples contained in that particular frame. This aids reduction of storaged requirement for digitised speech signals and reduces bandwidth for communication links in mediums such as mobile phone and internet systems.


Thursday, 29 November 2012

Lecture 8: Video Processing

Video Processing

Scottish inventor John Logie Baird (1846-1946) was a pioneer in video processing, inventing the television, of which a working version was first devised in 1926. His methods for displaying a stream of video were by using mechanical picture scanning with an electronic transmitter and receiver.


Baird with his invention, the first television

An old idea referred to as Persistence of Vision suggested that an after image persisted in the retina for one twenty-fifth of a second on the retina. This has since been dispelled and is now regarded as a myth as it's no longer considered true that a human perceives image as the result of persisted vision.


Describing motion perception is probably more accurate and relatable by the following two definitions: Phi phenomenon: The optical illusion of the perception of continuous motion between separate objects viewed in rapid succession and beta movement: The optical illusion that fixed images appear to move, despite the image not moving.


When a user is exposed to images at a rate of more than four a second, to the human eye the impression of movement is given off. 


Storage


For videos, copious amounts of storage is needed for certain types of files. The largest type that springs to mind would be Uncompressed HD Videos. Storing one could typically use approximately 1 gigabyte every 3 seconds. This estimation is based on the file needing 3 bytes per pixel, with a resolution of 1920 x 1090 by 60 frames per second. This totals roughly 373.2 megabytes per seconds.


Even in today's world of technological advancements, that amount of storage is far too bulky and awkward. In order to combat this, there are a large variety of compression algorithms and standards which can significantly reduce data usage in the storage, processing, streaming and transmission of videos.


Video Processing Vital Terminology:


Bit rate: How many bits per second are used to represent the video portion of the file. These vary vastly, typically from 300-8000 kbps. As expected, the lower bit rate represents a lower quality of video, similarly to sound files.


Interlacing or Progressive Video:


Interlaced video is the best method to make use of limited bandwidth for video transmission, especially when analogue transmissions were prominent. The viewer is tricked by the receiver, drawing the odd number lines twenty five times per second. After this, the even lines appear in the next frame and the process is repeated. Progressive video does not do this, avoiding interlacing and as a result appears much sharper. 


Resolution:


Resolution is the number of pixels by pixels needed to represent an image. At first, in the analogue days, video was represented by a resolution of 352 x 240 in North America and 352 x 288 in Europe. Advancements mean that today, high definition television can be represented by 1920 x 1200 pixels. The movement away from analogue signals has meant televisions can now produce blu-ray quality and at times even double up as a computer monitor.


This image shows a scale of definition, with the highest to the left

Video File Formats


MPEG-1:


  • Development started in 1988 and finalised in 1992, when the first MPEG-1 decoder became available
  • It could compress video to 26:1 and audio to 6:1
  • The format was designed to compress VHS quality digital video and CD audio without comprising quality as far as possible.
  • It is currently the most widely compatible lossy compression format in the world
  • It is part of the same standard as the MP3 audio format
  • MPEG-1 video and layer I/II audio can now be used in applications legally for free, as the patents expired in 2003, meaning royalties and license fees were no longer applicable
MPEG- 2

  • Work began on this format in 1990, before MPEG-1 was written
  • Its intentions were to extend the MPEG-1 format and use high bitrates (3-5 Mbits per second) to provide broadcast quality video in full.
MPEG- 4
  • A patented collection of methods made to define compression of audio and video, creating a standard for a number of audio and video codecs. (coder/decoder)
  • Shares many features with MPEG-1 and MPEG-2, whilst enabling 3D rendering, Digital Rights Management and other interactive features
Quick Time
  • Was first on the scene in 1991, produced by Apple, beating Microsoft by a year in their attempts to add a video format to windows.
  • Approved in 1998 by the ISO as the basis of the MPEG-4 file format
AVI (Audio Video Interleave)
  • First seen in 1992, implemented by Microsoft as part of its Video for Windows technology.
  • It takes the form of a file container, allowing synchronized audio and video playback
  • Sometimes files can appeared stretched or squeezed and lose definition due to the files not containing aspect ration information which can lead to them being rendered with square pixels.
  • However, certain types of software such as VLC and MPlayer have features which can solve problems with AVI file playback.
  • Despite being an older format, using AVI files can be beneficial. Their continuation means they can be played back on a wide range of systems, with only MPEG-1 being better in that respect.
  • The format is also very well documented, both by its creators Microsoft and various third parties.
WMV (Windows Media Video)

  • Made by Microsoft with various proprietary codecs
  • Files tend to be wrapped in Advanced Systems Format (ASF) and are not encoded
  • The ASF wrapper is frequently responsible for supporitng the Digital Rights Management
  • Files can also be placed inside an AVI container whilst based in Windows Media 9
  • Can be played on PCLinuxOS while using software including the aformentioned VLC and MPlayer
3GP
  • Two similar formats 3GPP (container for GSM phones such as T-Mobile) and 3GPP2 (container for CDMA phones such as Verizon)
  • 3GPP files frequently carry a 3GP file extension, whereas 3GPP2 files carry 3G2 extensopms
  • 3GP/3G2 store video files using an MPEG-4 format. Some mobile phones use MP4 to represent 3GP.
  • This method decreases bandwidth and storage whilst still trying to deliver a high quality of video.
  • Again, mentioning VLC and MPlayer, help Linux operating systems support 3GP files, they can be encoded and decoded with the method known as "FFmpeg".
FLV (Flash Video)

  • File container used to transmit video over the internet
  • Used by household internet names such as YouTube, Google, Yahoo and MetaCafe
  • While this format is open format, the codecs used in production are generally patented
Video Quality versus Speed of Access

  • The more compression, the more information is lost, leading to more distortion in picture
Algorithms that compress video still have problems with content which can be unpredictable and detail, the prime example being live sports evenets. Automatic Video Quality Assessment could provide a solution to this.

Sunday, 25 November 2012

Lab 4: Creating Signals

This lab is a demonstration on how to generate signals using Cool Edit Pro. The object of the task was to create a wave and then mix it with other waves to alter the shape of it. Firstly, I created the initial wave at 8 bit.


Harmonic
Number
1
2
3
4
5
6
7
8
9
Amplitude relative to Fundamental
1
0
1/3
0
1/5
0
1/7
0
1/9
Amplitude (dB)
 0

-9.54

-13.9

-16.9

-19.1
Frequency
400

1200

2000

2800

3600

The task was then to create a wave for the fundamental tone (the first one) and then for the third, fifth, seventh and ninth harmonics. The duration of the wave is 0.2 seconds. Images of each of the five waves are below in order. As you can see below, visually the images are decreasing in height and becoming more dense (compact).

The above table shows the theory of how the waves take such shape. The increase in frequency  (number of cycles per second) with each harmonic explains why the waves become more compact. With more frequency, more cycles are completed per second and as a result the image shows more instances of the waves. 


The decrease in height visible below is relative to the amplitude. The amplitude is the volume of noise that the sound wave is generating, this is measured in decibels. In Cool Edit Pro, the amplitude is depicted in the height of the wave. The decrease in height relates directly to the Amplitude dB section of the table. As you can see, the third harmonic sees a decrease in decibels from 0 to -9.54 from the fundamental. This is worked out by using a logarithm with this formula:


In chronological order, displayed below are the fundamental, the third harmonic, the fifth harmonic, the seventh harmonic and the ninth harmonic.


After creating waves for the fundamental and the third, fifth, seventh and ninth harmonic, the next task was to mix the waves together. The end result saw the wave was beginning to appear as in a square shape as shown below. Mixing the waves together is done using the mix paste option in Cool Edit Pro. You simply highlight the wave or part of the wave that you wish to use, click file then copy, open another wave, then click file, followed by mix paste.


The second part of the lab required a task similar to above, a mix of the below:

Harmonic Number
1
2
3
4
5
Amplitude relative to Fundamental
1
1/2
1/3
1/4
1/5
Amplitude dB
0
-6.02
-9.54
-12.04
-13.9
Frequency
400
800
1200
1600
2000

I then generated the 2nd and 4th harmonic and began to mix the waves together. As you can see they were beginning to take shape of a mountain by the end.


Lab 6: Image Manipulation

Welcome to my lab on image manipulation. The chosen software to perform this Lab is Adobe Fireworks. My first step was to download the image I was instructed to use in this process and open it in the fireworks software.

The image appeared as seen below. It was an image of a church with a backdrop of a blue sky at a sideways angle. In this blog I am going to explore the various different ways, using fireworks, that I can edit the appearance of this image.


Firstly, I identified that the angle the image was at was unhelpful and inconvenient to the viewer. For the viewer to look at the image in its natural state they would have to turn sideways. Thankfully, in fireworks, there are features which can help you get round this. I was able to rotate the image by 90 degrees, which made a lot easier, clearer and user friendly. There are various other angles you can rotate images by in fireworks, in both clockwise and anti-clockwise directions, but I decided that 90 degrees was the most fit for purpose for this lab.


After I had edited the image to show it at a better angle, my next task was to show some of the custom filters that fireworks has to offer. The two I decided to work on were motion blur and invert colours. Firstly, motion blur creates the illusion that the image was taken at high impact, such as by someone on the move. The result of this is that the detail of the image is highly compromised, as you can see below. The time on the clock is more difficult to make out and the individual bricks aren't quite as visible.


The next filter I chose to try out was inverting the colours. This operation makes the colours in the photograph transform so they are complete opposites of each other. This leaves the image looking far from natural.


After this I decided to edit the brightness of the photograph to see the results from that. The brightness is set zero in its default state, so I first decided to edit the image to so that it was at its minimum brightness, which on the Fireworks package is -100. The reduction in brightness gave the image the appearance that it was taken just prior to sunset, as it dulls the sky in a way that gives it a night-time feel.


My next step was to try the complete opposite of this, by increasing the brightness to maximum level, which expectedly is 100, given minimum level is -100. This transformation as shown below makes the image appear as if it was taken in broad daylight, at the time where the sun was at it's most prominent. Although the first image appears as if it was taken in daylight, this one increases that effect dramatically as is shown by the clearly visible change in shades of the blue sky.


My next step was to edit the contrast of the image. I first gave it the maximum contrast. This virtually removes all aspects of the image and gives it an animated, almost cartoon like vibe.


Next I went for the opposite effect by reducing the contrast as far as possible. Unlike the brightness, it was not possible for me to reduce the contrast as dramatically as -100 as that simply just makes the image appear totally grey and doesn't give as good an indication of the influence of reduced contrast as setting it to -85 like I did below. This shows how a reduction in contrast really makes the images dull, the sky becomes darker and less visible, as do all of the elements involved.

For me, there are various reasons these types of filtering could be used for the processing of digital images. The image may have been taken at an undesired time of day or in undesired weather conditions. Editing the brightness can give the image the appearance that it was taken at a different time of day and in different amounts of sunlight. By the same effect, reducing the contrast can aid this too, due to its dulling effects. Adding contrast can also aid the process, to an extent, but excessively doing so makes the image appear unnatural, although it could be argued this could be another potential use for filtering, as the user may be trying to obtain an unnatural and animated effect from the image. Filtering could also be used to accentuate a particular part of an image.